
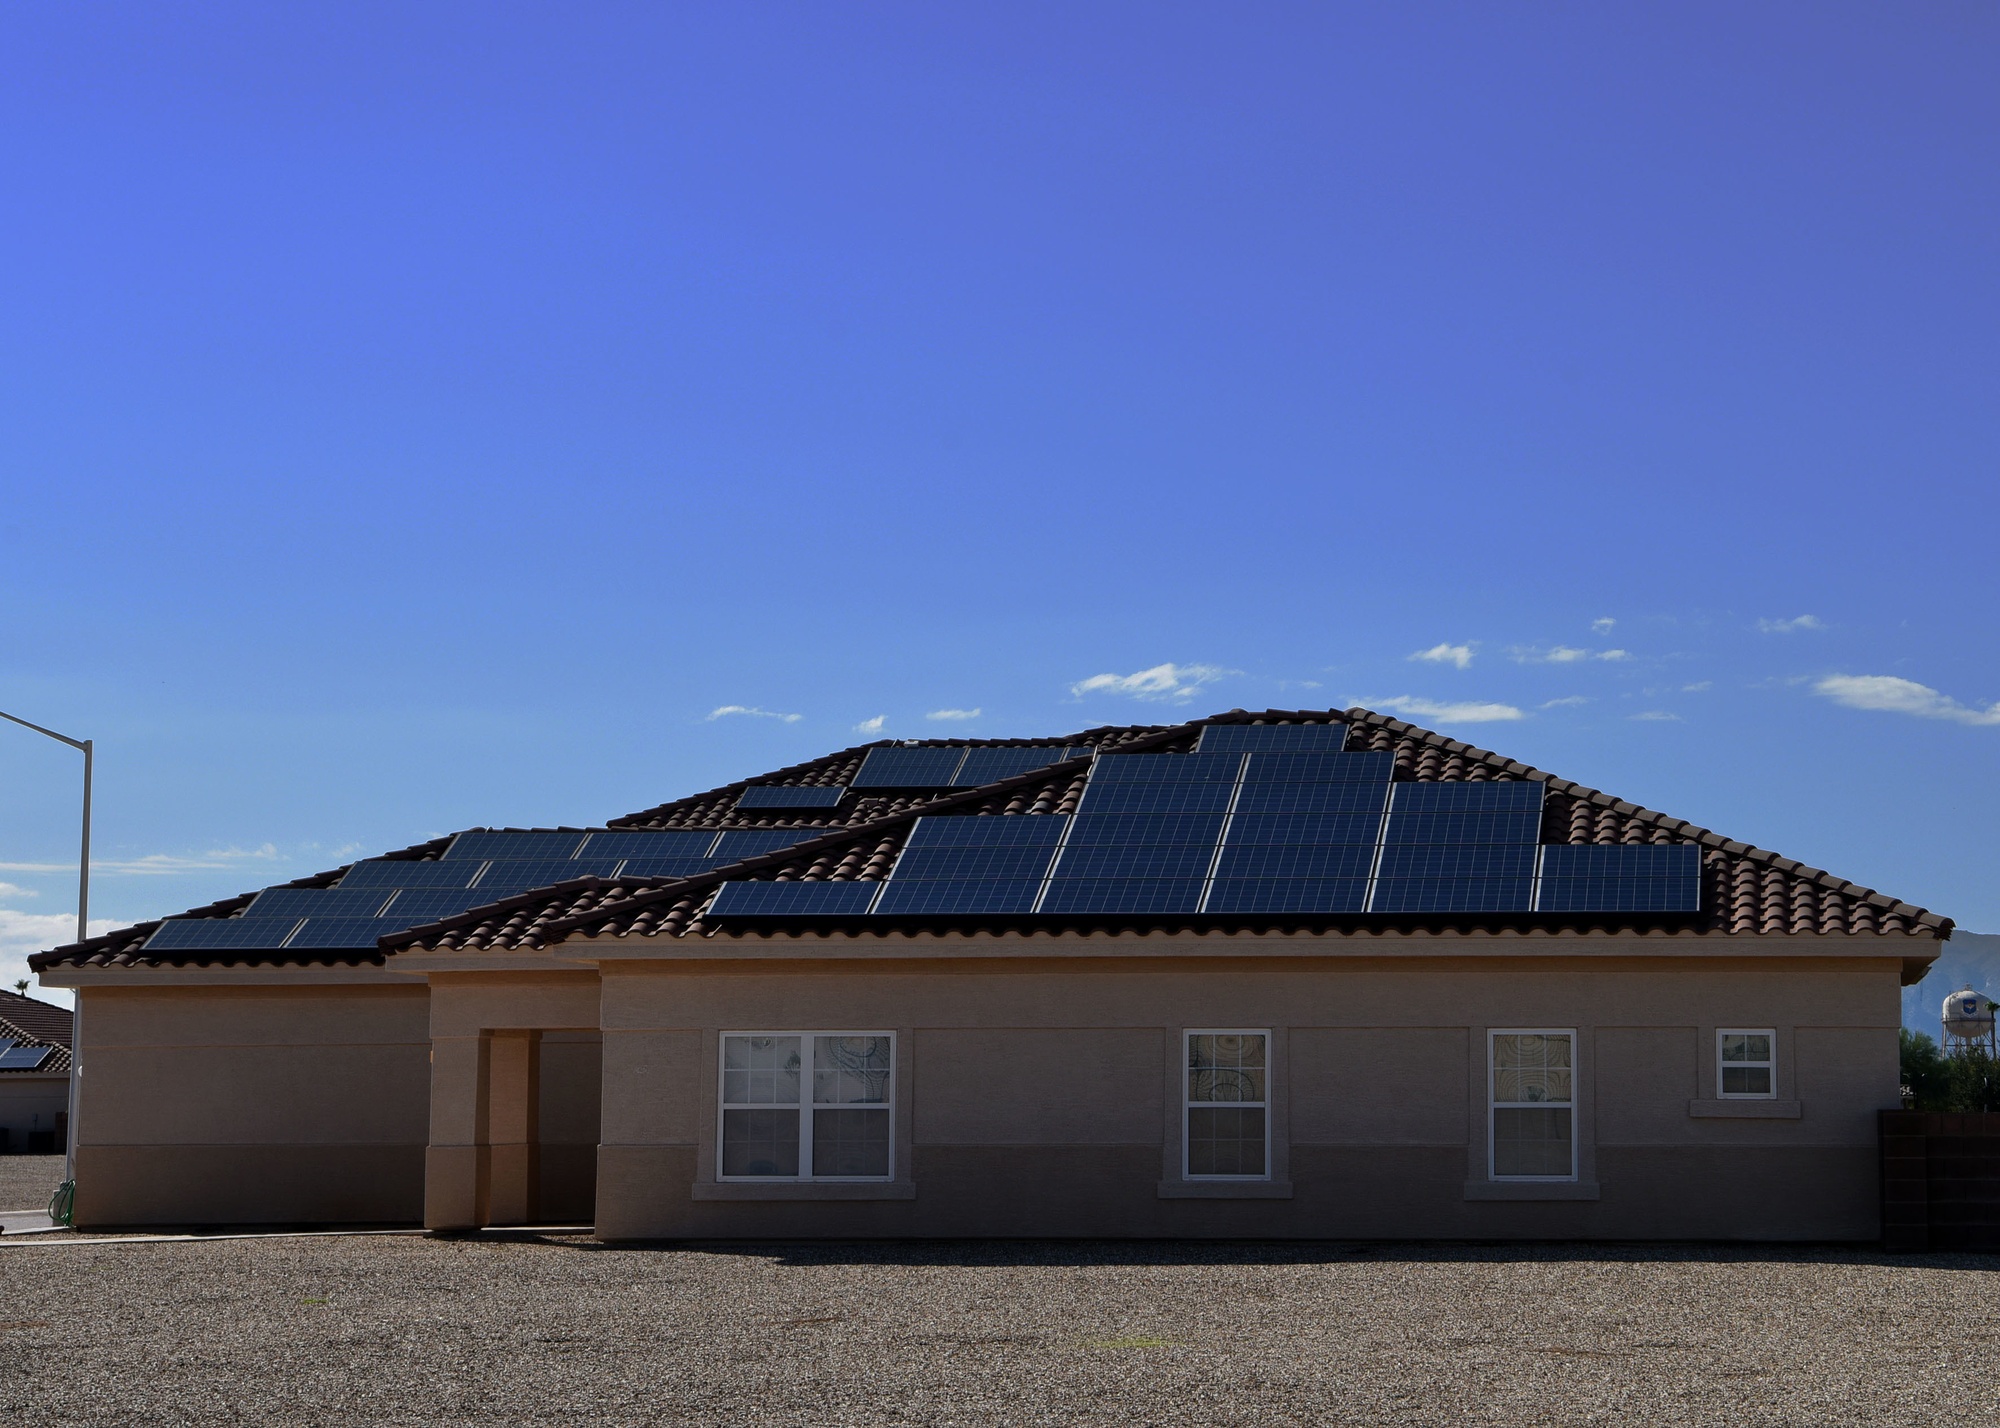
Lumena Energy partnered with a local homeowners association in Sedona, Arizona, to conduct a peer-to-peer energy pilot. We wanted to understand how residential solar could support a community energy network and what it would take to coordinate participating properties through a virtual power plant.
The partnership also gave us an opportunity to test the first iteration of GridTag. Working with connected equipment in a residential setting brought the study closer to the conditions a community energy program would need to accommodate.
Our published case study focused on one solar-connected property, identified as Device ID 5491:5682. Its records provided a detailed example within the broader pilot.
Public data · Arizona · 2024
Understanding the opportunity for arid communities
The pilot explored how locally generated energy could contribute to the needs of communities in arid regions. The questions included how to record activity at individual properties, account for energy transactions, and make participation understandable to residents.
Arizona’s subsequent energy data illustrates the relevance of that work. In 2024, renewable sources supplied about 20% of the state’s electricity generation, with solar accounting for 13% of total generation. These figures provide later regional context, rather than results from the Sedona pilot.
Arizona electricity generation · 2024
A virtual power plant coordinates distributed energy resources so they can contribute to a shared operating objective. For a residential community, that could involve coordinating solar with storage and flexible electricity use. Whether that coordination reduces costs or supports reliability depends on the participating equipment, operating arrangements, and measured performance.
Testing Parsecc and the first GridTag
The Sedona work included testing our first iteration of GridTag alongside the peer-to-peer pilot.
The accompanying compendium records the September 3, 2021 launch of Parsecc’s second version. It describes a network of more than 30 nodes across the United States, Canada, and the Dominican Republic. That count refers to the wider network, not the number of participating Sedona homes.
For the featured property, the published records tracked AC load, kilowatt-hours, data usage, energy transaction activity, and timestamps. These records allowed readers to examine individual entries alongside the case study’s summary figures.
Pilot documentation · Featured device
What the published records show
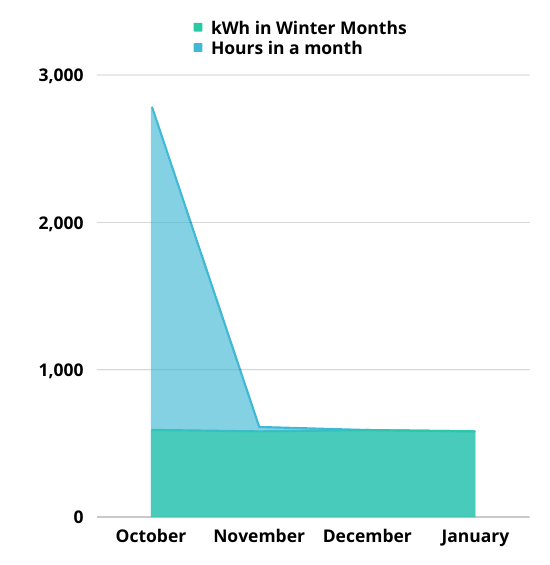
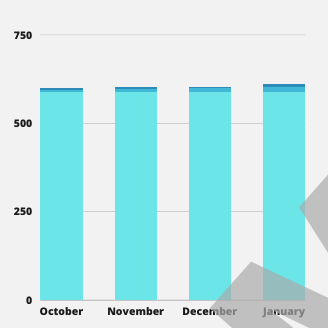
The compendium reports the following figures for the featured device:
| Accumulated energy | 14,505.5 kWh |
|---|---|
| Daily average | 59 kWh |
| Data generated | 1279.2mB |
| Sample billing rate | $0.045/kWh |
| Sample bill energy trades | 247 |
These are figures reported in the original case study. The summary and transaction records require reconciliation before using them to calculate household savings, annual production, or community-wide performance.
Making energy transactions understandable
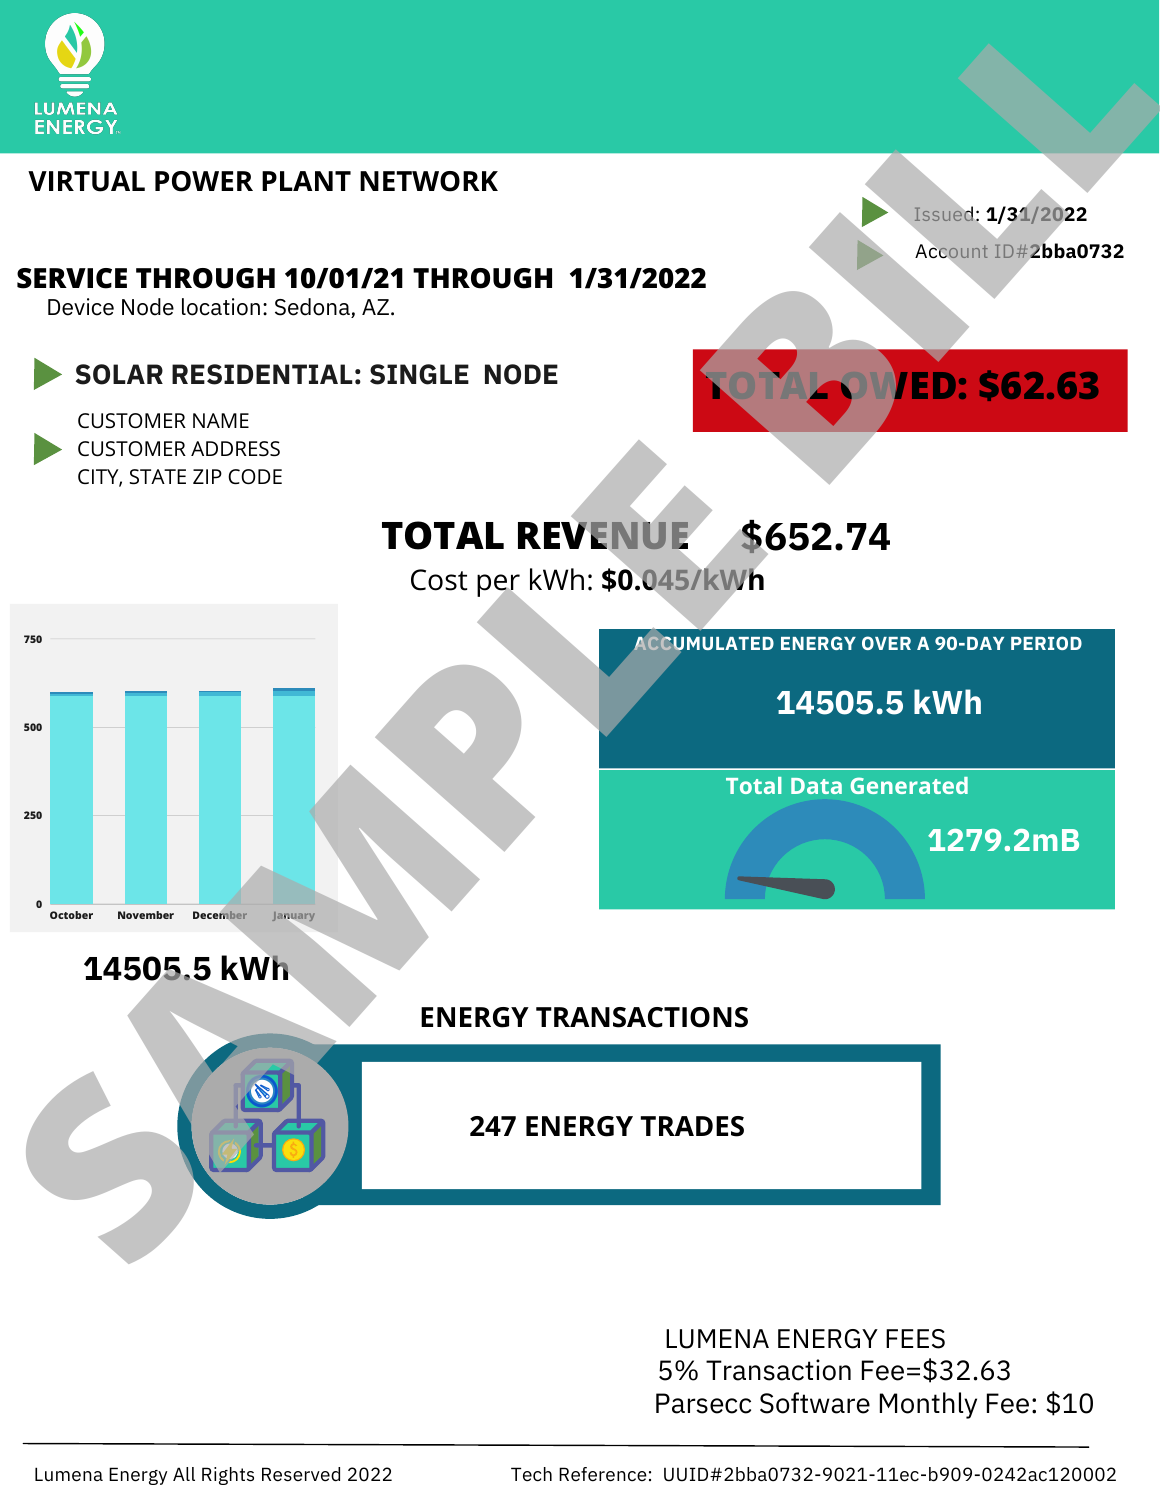
The original sample bill shows how energy activity could be presented to a participant. It brings together an energy quantity, a transaction rate, software fees, and a transaction fee in one statement.
Virtual power plant network
Residential energy statement
- Accumulated energy
- 14,505.5 kWh
- Rate used
- $0.045/kWh
- Total revenue shown
- $652.74
- Energy trades
- 247
- Data generated
- 1279.2mB
- 5% transaction fee shown
- $32.63
- Parsecc software monthly fee
- $10
Tech reference: UUID#2bba0732-9021-11ec-b909-0242ac120002
The example lists $652.74 in total revenue, a $32.63 transaction fee, a $10 monthly Parsecc software fee, and $62.63 owed. It remains a sample billing illustration. It does not establish that these amounts were paid or that a household achieved a corresponding reduction in its utility bill.
Source note: The compendium does not state the number of monthly software fees included in its total. Original amounts are retained rather than recalculated.
Compare with the original sample bill
The first page of transaction records
The first transaction page accompanies the statement so readers can inspect the recorded fields and timestamps. All 31 entries from that page are reproduced below, with the source’s headings and numerical precision preserved.
On a narrow screen, scroll the table horizontally to view every column. Times are reproduced exactly as recorded, including the source’s “Z” suffix.
| AC Load | kWh | Data Usage (kb) | Energy Trades per Watt | Timestamp |
|---|---|---|---|---|
| 9378.354437 | 58.9 | 5.2 | 323 | 2021-10-01T04:54:45.108Z |
| 9135.680182 | 58.8 | 5.2 | 135 | 2021-10-01T16:54:45.134Z |
| 9031.805739 | 59.0 | 5.2 | 282 | 2021-10-02T04:54:45.110Z |
| 8304.666715 | 59.0 | 5.2 | 317 | 2021-10-02T16:54:45.111Z |
| 8812.514474 | 58.9 | 5.2 | 243 | 2021-10-03T04:54:45.113Z |
| 8527.830582 | 58.9 | 5.2 | 260 | 2021-10-03T16:54:45.115Z |
| 8718.500069 | 59.0 | 5.2 | 199 | 2021-10-04T04:54:45.113Z |
| 8289.857217 | 59.0 | 5.2 | 182 | 2021-10-04T16:54:45.110Z |
| 8577.156908 | 58.9 | 5.2 | 131 | 2021-10-05T04:54:45.116Z |
| 9363.976598 | 59.0 | 5.2 | 244 | 2021-10-05T16:54:45.117Z |
| 9066.404463 | 59.1 | 5.2 | 342 | 2021-10-06T04:54:45.125Z |
| 8333.741589 | 59.0 | 5.2 | 293 | 2021-10-06T16:54:45.142Z |
| 8669.321532 | 59.0 | 5.2 | 183 | 2021-10-07T04:54:45.126Z |
| 8897.241569 | 58.9 | 5.2 | 175 | 2021-10-07T16:54:45.122Z |
| 8586.605242 | 59.1 | 5.2 | 235 | 2021-10-08T04:54:45.124Z |
| 8648.847735 | 59.0 | 5.2 | 243 | 2021-10-08T16:54:45.132Z |
| 8903.71078 | 59.0 | 5.2 | 281 | 2021-10-09T04:54:45.140Z |
| 8710.135809 | 59.0 | 5.2 | 135 | 2021-10-09T16:54:45.126Z |
| 8845.737693 | 58.8 | 5.2 | 151 | 2021-10-10T04:54:45.138Z |
| 8383.064402 | 59.0 | 5.2 | 308 | 2021-10-10T16:54:45.126Z |
| 8474.41634 | 59.1 | 5.2 | 287 | 2021-10-11T04:54:45.141Z |
| 9334.535773 | 58.9 | 5.2 | 279 | 2021-10-11T16:54:45.147Z |
| 9259.244404 | 59.0 | 5.2 | 162 | 2021-10-12T04:54:45.135Z |
| 8539.275937 | 58.9 | 5.2 | 251 | 2021-10-12T16:54:45.130Z |
| 9693.861363 | 58.9 | 5.2 | 271 | 2021-10-13T04:54:45.129Z |
| 9341.00809 | 58.9 | 5.2 | 326 | 2021-10-13T16:54:45.127Z |
| 8821.763651 | 58.9 | 5.2 | 327 | 2021-10-14T04:54:45.148Z |
| 9172.972533 | 59.0 | 5.2 | 240 | 2021-10-14T16:54:45.283Z |
| 8395.166613 | 58.8 | 5.2 | 176 | 2021-10-15T04:54:45.139Z |
| 8759.741459 | 59.1 | 5.2 | 278 | 2021-10-15T16:54:45.131Z |
| 9085.061793 | 59.0 | 5.2 | 166 | 2021-10-16T04:54:45.131Z |
Device node location: Sedona, AZ. · UUID#2bba0732-9021-11ec-b909-0242ac120002. The source heading “Energy Trades per Watt” is retained as published; no revised unit definition is inferred.
Public research · U.S. Department of Energy · January 2025
The broader role of virtual power plants
In its January 2025 update, the U.S. Department of Energy identified a pathway to 80–160 GW of virtual power plant deployment by 2030, enough to serve approximately 10–20% of peak demand. Those figures describe a national deployment opportunity, rather than a forecast for this project.
A deployment pathway described in 2025, not a measurement of current capacity. Source: U.S. Department of Energy, January 10, 2025
The Sedona pilot addressed an earlier, local question: how could participating residential properties become part of an energy network with records that residents and operators could examine?
What the pilot contributed
The HOA partnership provided a community setting for exploring peer-to-peer energy trading and testing the first GridTag iteration. The featured property supplied a documented example of device activity, transaction records, and sample billing.
Further evaluation would require a reconciled operating dataset and measurements of participant costs, equipment performance, and response during relevant grid conditions. Those measurements would support a stronger assessment of how the approach could serve arid communities.